When you purchase a DNA test from 23andMe, your results include a breakdown of your ancestral locations. This is also known as your ethnicity or admixture report. But how accurate is the composition?
This article takes an in-depth look at how 23andMe calculates your percentages and ancestor locations. Then we review accuracy and other common questions that customers ask.
How to Read Your 23andMe Ancestry Composition (Ethnicity Estimates)
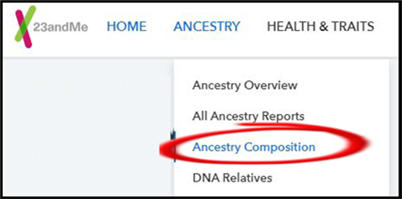
You will find the ethnicity estimates on 23andMe by using the “Ancestry Composition” link under the main Ancestry drop-down menu.
You will see a percentage breakdown on the left and a map on the right.
The breakdown on the left represents ancestral regions that could go back many hundreds of years. The map on the right tries to represent the locations of your more recent ancestors.
The next section describes how to interpret the hierarchy breakdown in the left panel.
23andMe Region Hierarchy
The picture below shows a portion of my breakdown. I’ve labeled the different levels of the region hierarchy.
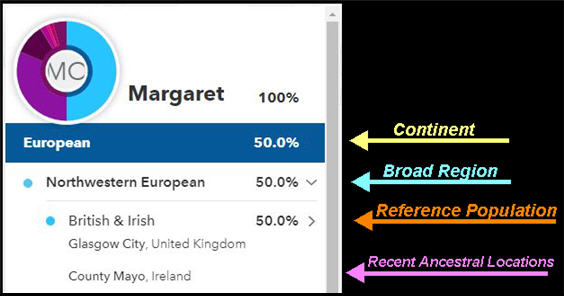
Continental top layer
The top layer of your breakdown is at the continent level.
23andMe originally started with three continental regions, way back in 2008. Your breakdown back then showed percentages of European, East Asian, and African heritage.
The top-level has now expanded to six categories:
- European
- Sub-Saharan African
- Western Asian & North African
- Central & South Asian
- East Asian & Indigenous American
- Melanesian
I don’t think there are many complaints about 23andMe’s continental estimates. They are spot-on for me, with a 50/50 split between my Irish maternal heritage and my African paternal heritage.
Broad regions
23andMe’s broad regions cover a wide geography e.g. “Northwestern European”. This is the current list of their regions within the continental categories:
| European | Sub-Saharan African | Western Asian & North African | East Asian & Indigenous American | Central & South Asian |
| Northwestern European | Northern East African | Arab, Egyptian & Levantine | Chinese & Southeast Asian | Central Asian, Northern Indian & Pakistani |
| Eastern European | Congolese & Southern East African | North African | Indigenous American | Southern Indian |
| Southern European | West African | Northern West Asian | Japanese & Korean | Southern South Asian |
| Ashkenazi Jewish | African Hunter-Gatherer | Northern Asian |
The Melanesian category doesn’t have a further breakdown.
Reference Populations
The next level down is where things get more interesting for customers. You will often see one or two countries as part of the label. Each label represents a 23andMe Reference Population, which I’ll explain in-depth later.
Just think of it now as a more specific level beneath the broader region.
My European ancestry has been put entirely against the reference population “British & Irish”.
Why are these two countries stuck together? This means that the 23andMe analysis cannot distinguish between DNA within the two adjacent islands.
However, their analysis can draw a line between “British & Irish” and another reference population labeled as “French & German”.
I think it would be useful for customers if 23andMe showed all the reference populations in the breakdown, with a zero percent beside the ones that don’t apply.
If you’re interested in which reference populations you aren’t matching, you’ll find the list here.
If you were looking at your 23andMe composition report before 2018, your results would stop at this level.
However, they rolled out a different set of estimates in April 2018.
Recent Ancestor Locations
I have no Recent Ancestor Locations beneath my African breakdown. Others may see locations like “Burundian” or “Nigerian”.
The absence of locations simply means that my DNA doesn’t match 23andMe’s current rather limited African groups.
However, I have plenty of Recent Ancestor Locations beneath my “British & Irish” breakdown.
What’s the difference between Reference Populations and Recent Ancestor Locations? Good question. I’ll explain that in a later section.
The Ancestry Composition Map
The larger part of your display is an interactive visualization map.
When you open the report, the display is color-coded at the broad region level.
Unlike some other websites, you don’t zoom in vai the map to see the lower levels.
If you want to delve into the Recent Ancestor Locations, you need to navigate via the breakdown in the left pane. You can’t actually click on an ancestor location in the breakdown.
Instead, click on the Reference Population above your target location. This jumps the display down to the level of recent ancestor locations. The map will zoom in on the countries involved.
To be honest, I think the navigation with this map is a bit confusing.
What Is The 23andMe Reference Panel?
When 23andMe processes your DNA kit, it compares your results to a large collection of reference samples that it hopes represent distinct ethnicities across the world.
In theory, 23andMe would be most accurate if they could use historic DNA samples dating back centuries. This may be possible in the future with technology developments, but it’s not possible right now.
Therefore, your composition analysis from any DNA testing company is a compromise based on modern samples.
The goal is to limit these reference DNA samples to individuals who are of a single ethnicity. When you think about how many Western populations are increasingly of mixed heritage, this is not an easy task.
I’ll use the infographic below to describe the process for creating reference panels. Let’s work from left to right.
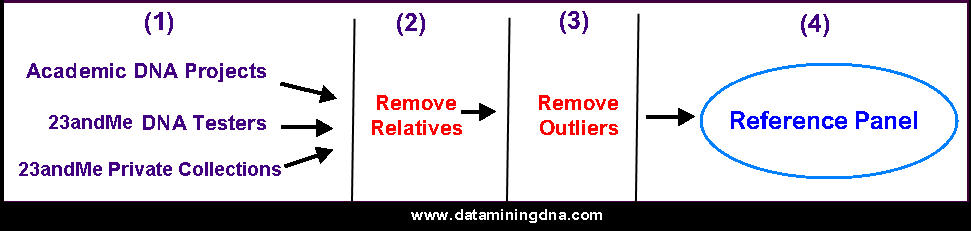
Academic DNA Projects
23andMe draws from DNA samples that were collected by three large academic projects. Ancestry.com uses the same projects, by the way. Both companies rely on these projects being accurate when they identified samples as having a single ethnicity.
23andMe Customers
Another set of DNA samples come from 23andMe customers who consent to be part of the research project.
The customers must also state that their four grandparents were born in the same country.
23andMe Private Collections
23andMe’s white paper on their ethnicity algorithm says that the DNA samples only came from academic projects and 23andMe customers. But this paper was published in 2014.
Since then, 23andMe has greatly expanded its regions for non-European heritage.
I’ve seen the company refer to “private collections” as part of their reference panels. I assume that the company actively distributed DNA kits to volunteers in countries that were not well-represented in their database.
Next Step: Remove Relatives
The 23andMe ethnicity algorithm is based on statistics. So, they need to be careful that multiple family members amongst their customers don’t skew the sampling.
Once they’ve gathered all the possible DNA samples, they check them for close family members. This is simply a matter of finding samples that share a high number of centimorgans.
The algorithm will ensure that only one of a close cluster will be allowed through to the next step.
Next Step: Remove Outliers
Once family members have been eliminated, the next step is to clean up statistical outliers.
Let’s say a tester has stated that his four grandparents are from Scotland. But his DNA is matching primarily to samples from Poland. This sample will be set aside.
How could this situation happen? It could be a case of adoption, where the tester is unaware of his biological heritage.
Box 4: Reference Panel
The outcome of the step-by-step process is a panel that represents distinct groupings of DNA.
It is this panel to which your DNA is compared.
How Does 23andMe Calculate Your Ethnicity Composition?
I’ll give you the basics here so that your percentages aren’t coming from a black box.
Let’s say your four grandparents hail from Scotland, Italy, Uganda, and Northern China.
We’ll assume that the ancestral lines stayed within those regions for many generations. Your father’s ethnicity is primarily Scotland/Italy, and your mother is primarily Uganda/Northern China.
But the 23andMe algorithms don’t know your ethnicity when you submit your DNA test. How do they calculate your composition?
23andMe chops up your DNA into many small adjacent pieces. The size is chosen to be small enough to only hold DNA inherited from a single ancestor going back generations.
For our example, one piece of DNA either came from Scotland, Italy, Uganda, or Northern China. A bigger piece of DNA may be inherited from a jumble of two or three ancestors. This is why smaller is better!
Phasing
The next major challenge for consumer DNA testing companies is that the current technology doesn’t tell them which small piece comes from your mother and which comes from your father.
23andMe uses a complex piece of statistical analysis to infer whether a piece of DNA is maternal or paternal. This is called phasing.
But this is a compromise. When better DNA sampling technology becomes more affordable, the ethnicity estimates will be of higher accuracy.
Comparing to reference populations
Let’s take one of these small pieces of your DNA that represent a single ancestor of one ethnicity.
Now, the Reference Panel becomes the key. 23andMe compares the small piece of DNA with all the different reference populations. It’s looking for the one that’s most similar.
Let’s say that the first piece is most similar to the British & Irish reference population. In our example, you inherited this piece from your father’s paternal Scottish side.
Smoothing
23andMe introduced a major change to the composition estimates in 2020. Many customers noticed that their percentages went up or down. Some customers lost specific regions completely.
This change was due to a new mathematical step in the process. 23andMe calls this “smoothing”.
One of the goals of smoothing is to fix errors in phasing i.e. when DNA is assigned to the wrong parent.
Another goal is to kick out unusual patterns. Our example DNA was inherited from four regions. About 25% of our DNA pieces should match reference samples from one of these four.
If a couple of pieces out of many thousands show up as being East Asian, then earlier estimates may have given you “trace” ancestry from this fifth region. Smoothing eliminated a lot of trace and small percentage ancestries.
Final Results
We worked through an example of a single piece of DNA. The 23andMe algorithms move through tens of thousands of these small segments to build up a full picture.
What Are Recent Ancestor Locations?
23andMe introduced Recent Ancestor Locations in 2012. They are a level below the reference populations in your composition. You may not have any under some of your regions.
23andMe say that Recent Ancestor Locations are based on over 400 thousand 23andMe customers “of known ancestry”. I’ve put that in quotes, as I’m not clear as to how 23andMe “know” the ancestry.
In their White Paper on reference populations, they mention a fairly detailed survey that they gave to nearly 9,000 customers who agreed to participate as reference samples.
Perhaps they used the same method with these 400K customers.
The other possibility is that they used the family background information that customers can provide in their account profiles. This is where 23andMe lets you enter the birthplaces of your four grandparents.
23andMe aren’t as open about these calculations as they are about the region breakdown.
However, it seems that the estimates are based on the people within that 400K customer base who are our DNA relatives.
By using DNA matching, the locations should represent more recent generations than the general reference populations. This should be ancestral heritage within the last two hundred years.
Levels Of Confidence
Using statistics and probabilities means that there is an element of uncertainty with these estimates.
23andMe assigns a level of confidence to their estimates of Recent Ancestor Locations. You can see two different levels in the picture below.
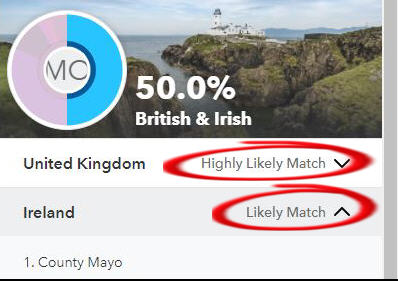
These are the different levels:
- Highly Likely Match: 80% confidence
- Likely Match: 50-79.9% confidence
- Possible Match: 30-49.9% confidence
How Accurate Is The 23andMe Ancestry Composition?
Two words have kept cropping up in this article’s review of the 23andMe composition: statistics and estimates. Your composition is a collection of estimates based on statistical comparisons to a reference database.
Several factors may reduce the accuracy. Let’s look at some of these challenges.
Accuracy of the Reference Panel
I mentioned that the reference panel is already a step down from using centuries-old DNA.
Aside from that, 23andMe relies on the reported genealogy of testers to be accurate. But family trees can be wrong.
Less Developed Regions
Many countries or communities haven’t had a tradition of recording birth, marriage, and death events as part of civil administration.
So, 23andMe must rely on verbal testimony to where grandparents were born when they choose samples for their reference panel.
Now consider countries and regions that suffered civil war or economic deprivation within the last hundred years. Both lead to population migration and sometimes the loss of generational knowledge.
The problem is that this leaves 23andMe with regions where the number of testers will not be statistically significant.
The Challenge of Statistical Analysis
I’ll simply mention here that 23andMe has chosen one mix of statistical modeling techniques over other possibilities.
Have they got it right? And if it turns out to be right for one customer, will the same modeling apply to the next?
Judging by reactions on genealogy forums, no DNA testing company has got ethnicity estimates right for everybody.
My experience with the 23andMe Ancestry Composition
I’m satisfied with the accuracy of my composition down to the regional level.
However, the breakdown goes off the rails for me at the lowest level.
Both Ancestry.com and MyHeritage have a similar feature to 23andMe’s Recent Ancestor Locations. These two competitors have pinpointed my recent heritage to a small county within Ireland.
In contrast, 23andMe puts my “highly likely” ancestor location in Scotland. They can’t all be right.
It’s possible that 23andMe is the correct version. But this does not match with my genealogy research.
How Often Does 23andMe Change Ancestry Compositions?
Customers who tested with the V5 chip (i.e. after late 2017) have seen changes to their ancestry compositions about once a year.
Here are the dates when major changes were rolled out to customers:
- Sep 18, 2020
- Sep 06, 2019
- May 24, 2019
- Nov 08, 2017
We are probably due a rollout in late 2021 or in 2022.
Does 23andMe Test For Native American Ethnicity?
This is a common question from new testers who are surprised that their ethnicity does not match verbal family history.
I listed the 23andMe regions in a previous section. They include an “Indigenous American” reference panel.
Why does 23andMe not show my Native American heritage?
If you don’t see a percentage of Indigenous American in your composition, it doesn’t mean that you don’t have Native American ancestors.
Due to the random nature of inheritance, you may not inherit DNA from all your great-grandparents.
It’s possible that an ethnic region has been reduced to amounts that cannot be detected by a DNA test. Of course, the same logic applies to any ethnic region you may feel you are missing.
Why Does My Parent Have Populations that I Don’t?
Your mother has tested, and her composition has a percentage of 1% for Italian ancestry. But Italy doesn’t appear at all in your breakdown. What’s going on?
Given that your mum appears at the top of your list of DNA relatives – there’s no hospital baby-swapping going on.
Does this prove that ancestry compositions are nonsense? No, not at these small percentages.
This is where the random nature of inheritance comes into play. You don’t get a complete representation of your mother’s DNA in the half that you inherit.
The small percentage that 23andMe identified as Italy may not be present in your DNA.
However, it may be present in the DNA of your sibling! Which brings us to the next section.
Why Does My Sibling Have Ancestries that I Don’t?
You and your siblings do not inherit the exact same portions of DNA from your parents.
A small percentage, such as 1% Italian, may appear in your brother’s composition and be absent from your own.
Transfer Your DNA To Get Alternate Ethnicity Estimates
Other major companies also provide ethnicity estimates. You don’t necessarily have to pay to see additional reports.
You can download your raw DNA from 23andMe and upload it for free to other reputable sites.
You can find all your options in our article on where you can upload your DNA. We have tutorials for most DNA websites.
If you upload your DNA to GEDmatch, their ethnicity estimates are available for free. There is a rather bewildering array of different estimates on offer.
You can get an overview with our guide to the best ethnicity calculators on GEDmatch.
If you upload your DNA to MyHeritage, the ethnicity estimates usually require an unlock fee. I’m not convinced that the MyHeritage estimates are better than 23andMe.
However, the company added a new feature in 2020 that greatly improves their ethnicity features. You can check out our article on MyHeritage Genetic Groups.
We’ll done. Very helpful and informative.
Thanks so much.
Blessings,
David